

Cluster Nodes Usage Rate
When checking the cluster, we noticed an unusually high memory usage. We see that one node is fully utilized while the other shows little load. This often happens when a cluster with less than three nodes is upgraded at the nodes. Here we explain the reason for it.
Finding Nodes Workload
First, we check how many nodes are in the cluster and the current load of CPU/memory.
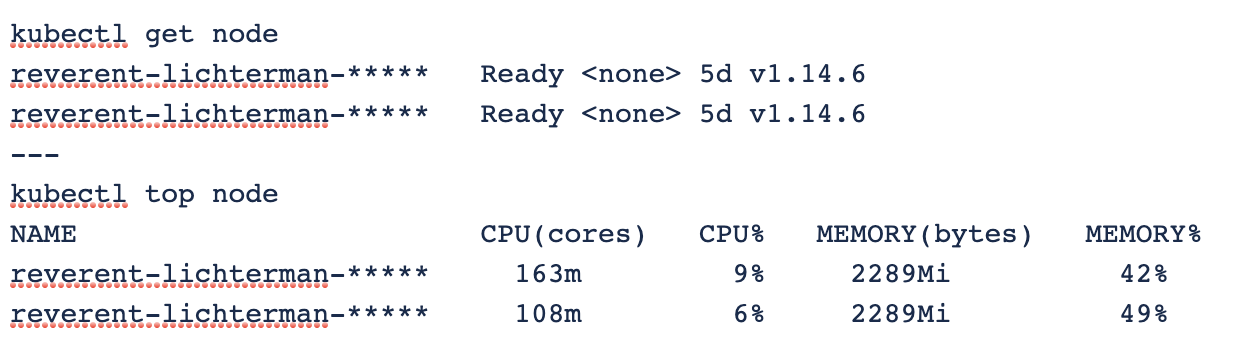
The command kubectl top node shows the current node usage. In the example, there are two running nodes.
First the node is cordoned, so that no new pods are scheduled to this node.
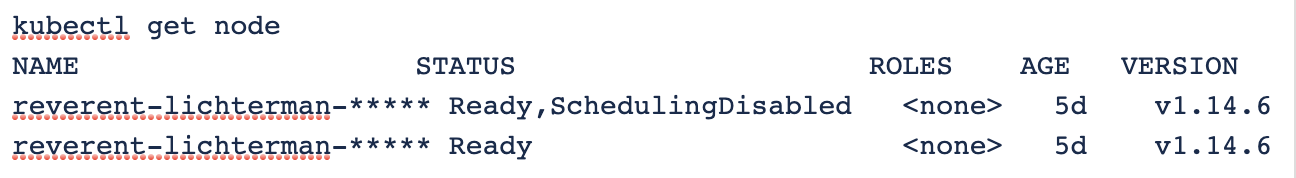
Then the node is drained so that it is made completely empty, and the pods that were previously running on the native node are distributed to all other nodes in the cluster. With only two nodes, everything is placed on exactly the other node and then we have a high load on this node.
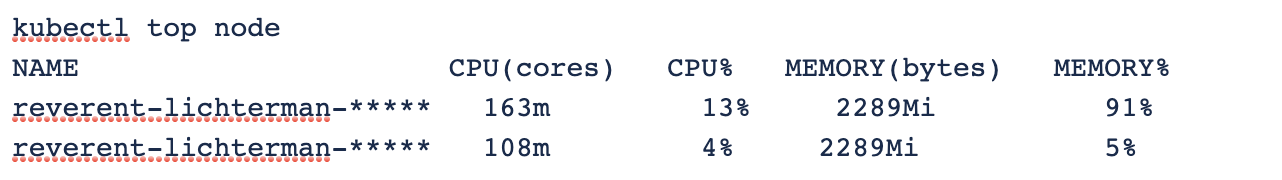
When the second node is back after the update, the pods are not automatically distributed to both nodes. This leads to the initially observed imbalance.
Some Tips
- We recommend using at least three nodes, as this allows loads to be better distributed during upgrades.
- The tool ‘popeye’ analyzes clusters and makes suggestions for improvement based on best practices.
- Upgrade the nodes to the latest version and perform the final step in section Kubernetes Updates.